
Because the pundits’ predictions are often unreliable – purposefully so or not – it is important to develop your own understanding of the economy and the factors shaping it. Paying attention to economic indicators can give you an idea of where the economy is headed so you can plan your finances and even your career accordingly.
There are two types of indicators you need to be aware of:
- Leading indicators often change prior to large economic adjustments and, as such, can be used to predict future trends.
- Lagging indicators, however, reflect the economy’s historical performance and changes to these are only identifiable after an economic trend or pattern has already been established.
Leading Indicators
Because leading indicators have the potential to forecast where an economy is headed, fiscal policymakers and governments make use of them to implement or alter programs in order to ward off a recession or other negative economic events. The top leading indicators follow below:1. Stock Market
Though the stock market is not the most important indicator, it’s the one that most people look to first. Because stock prices are based in part on what companies are expected to earn, the market can indicate the economy’s direction if earnings estimates are accurate.For example, a strong market may suggest that earnings estimates are up and therefore that the overall economy is preparing to thrive. Conversely, a down market may indicate that company earnings are expected to decrease and that the economy is headed toward a recession.
However, there are inherent flaws to relying on the stock market as a leading indicator. First, earnings estimates can be wrong. Second, the stock market is vulnerable to manipulation. For example, the government and Federal Reserve have used quantitative easing, federal stimulus money, and other strategies to keep markets high in order to keep the public from panicking in the event of an economic crisis.
Moreover, Wall Street traders and corporations can manipulate numbers to inflate stocks via high-volume trades, complex financial derivative strategies, and creative accounting principles (legal and illegal). Since individual stocks and the overall market can be manipulated as such, a stock or index price is not necessarily a reflection of its true underlying strength or value.
Finally, the stock market is also susceptible to the creation of “bubbles,” which may give a false positive regarding the market’s direction. Market bubbles are created when investors ignore underlying economic indicators, and mere exuberance leads to unsupported increases in price levels. This can create a “perfect storm” for a market correction, which we saw when the market crashed in 2008 as a result of overvalued subprime loans and credit default swaps.
2. Manufacturing Activity
Manufacturing activity is another indicator of the state of the economy. This influences the GDP (gross domestic product) strongly; an increase in which suggests more demand for consumer goods and, in turn, a healthy economy. Moreover, since workers are required to manufacture new goods, increases in manufacturing activity also boost employment and possibly wages as well.However, increases in manufacturing activity can also be misleading. For example, sometimes the goods produced do not make it to the end consumer. They may sit in wholesale or retailer inventory for a while, which increases the cost of holding the assets. Therefore, when looking at manufacturing data, it is also important to look at retail sales data. If both are on the rise, it indicates there is heightened demand for consumer goods. However, it’s also important to look at inventory levels, which we’ll discuss next.
3. Inventory Levels
High inventory levels can reflect two very different things: either that demand for inventory is expected to increase or that there is a current lack of demand.In the first scenario, businesses purposely bulk up inventory to prepare for increased consumption in the coming months. If consumer activity increases as expected, businesses with high inventory can meet the demand and thereby increase their profit. Both are good things for the economy.
In the second scenario, however, high inventories reflect that company supplies exceed demand. Not only does this cost companies money, but it indicates that retail sales and consumer confidence are both down, which further suggests that tough times are ahead.
4. Retail Sales
Retail sales are particularly important metrics and function hand in hand with inventory levels and manufacturing activity. Most importantly, strong retail sales directly increase GDP, which also strengthens the home currency. When sales improve, companies can hire more employees to sell and manufacture more product, which in turn puts more money back in the pockets of consumers.One downside to this metric, though, is that it doesn’t account for how people pay for their purchases. For example, if consumers go into debt to acquire goods, it could signal an impending recession if the debt becomes too steep to pay off. However, in general, an increase in retail sales indicates an improving economy.
5. Building Permits
Building permits offer foresight into future real estate supply levels. A high volume indicates the construction industry will be active, which forecasts more jobs and, again, an increase in GDP.But just like with inventory levels, if more houses are built than consumers are willing to buy, it takes away from the builder’s bottom line. To compensate, housing prices are likely to decline, which, in turn, devalues the entire real estate market and not just “new” homes.
6. Housing Market
A decline in housing prices can suggest that supply exceeds demand, that existing prices are unaffordable, and/or that housing prices are inflated and need to correct as a result of a housing bubble.In any scenario, declines in housing have a negative impact on the economy for several key reasons:
- They decrease homeowner wealth.
- They reduce the number of construction jobs needed to build new homes, which thereby increases unemployment.
- They reduce property taxes, which limits government resources.
- Homeowners are less able to refinance or sell their homes, which may force them into foreclosure.
7. Level of New Business Startups
The number of new businesses entering the economy is another indicator of economic health. In fact, some have claimed that small businesses hire more employees than larger corporations and, thereby, contribute more to addressing unemployment.Moreover, small businesses can contribute significantly to GDP, and they introduce innovative ideas and products that stimulate growth. Therefore, increases in small businesses are an extremely important indicator of the economic well-being of any capitalist nation.
Lagging Indicators
Unlike leading indicators, lagging indicators shift after the economy changes. Although they do not typically tell us where the economy is headed, they indicate how the economy changes over time and can help identify long-term trends.1. Changes in the Gross Domestic Product (GDP)
GDP is typically considered by economists to be the most important measure of the economy’s current health. When GDP increases, it’s a sign the economy is strong. In fact, businesses will adjust their expenditures on inventory, payroll, and other investments based on GDP output.However, GDP is also not a flawless indicator. Like the stock market, GDP can be misleading because of programs such as quantitative easing and excessive government spending. For example, the government has increased GDP by 4% as a result of stimulus spending and the Federal Reserve has pumped approximately $2 trillion into the economy. Both of these attempts to correct recession fallout are at least partially responsible for GDP growth.
Moreover, as a lagging indicator, some question the true value of the GDP metric. After all, it simply tells us what has already happened, not what is going to happen. Nonetheless, GDP is a key determinant as to whether or not the United States is entering a recession. The rule of thumb is that when the GDP drops for more than two quarters, a recession is at hand.
2. Income and Wages
If the economy is operating efficiently, earnings should increase regularly to keep up with the average cost of living. When incomes decline, however, it is a sign that employers are either cutting pay rates, laying workers off, or reducing their hours. Declining incomes can also reflect an environment where investments are not performing as well.Incomes are broken down by different demographics, such as gender, age, ethnicity, and level of education, and these demographics give insight into how wages change for various groups. This is important because a trend affecting a few outliers may suggest an income problem for the entire country, rather than just the groups it effects.
3. Unemployment Rate
The unemployment rate is very important and measures the number of people looking for work as a percentage of the total labor force. In a healthy economy, the unemployment rate will be anywhere from 3% to 5%.When unemployment rates are high, however, consumers have less money to spend, which negatively affects retail stores, GDP, housing markets, and stocks, to name a few. Government debt can also increase via stimulus spending and assistance programs, such as unemployment benefits and food stamps.
However, like most other indicators, the unemployment rate can be misleading. It only reflects the portion of unemployed who have sought work within the past four weeks and it considers those with part-time work to be fully employed. Therefore, the official unemployment rate may actually be significantly understated.
One alternative metric is to include as unemployed workers those who are marginally attached to the workforce (i.e. those who stopped looking but would take a job again if the economy improved) and those who can only find part-time work.
4. Consumer Price Index (Inflation)
The consumer price index (CPI) reflects the increased cost of living, or inflation. The CPI is calculated by measuring the costs of essential goods and services, including vehicles, medical care, professional services, shelter, clothing, transportation, and electronics. Inflation is then determined by the average increased cost of the total basket of goods over a period of time.A high rate of inflation may erode the value of the dollar more quickly than the average consumer’s income can compensate. This, thereby, decreases consumer purchasing power, and the average standard of living declines. Moreover, inflation can affect other factors, such as job growth, and can lead to decreases in the employment rate and GDP.
However, inflation is not entirely a bad thing, especially if it is in line with changes in the average consumer’s income. Some key benefits to moderate levels of inflation include:
- It encourages spending and investing, which can help grow an economy. Otherwise, the value of money held in cash would be simply corroded by inflation.
- It keeps interest rates at a moderately high level, which encourages people to invest their money and provide loans to small businesses and entrepreneurs.
- It’s not deflation, which can lead to an economic depression.
These issues cause the supply of money to contract even further, which leads to higher levels of deflation and creates a vicious cycle that may result in an economic depression.
5. Currency Strength
A strong currency increases a country’s purchasing and selling power with other nations. The country with the stronger currency can sell its products overseas at higher foreign prices and import products more cheaply.However, there are advantages to having a weak dollar as well. When the dollar is weak, the United States can draw in more tourists and encourage other countries to buy U.S. goods. In fact, as the dollar drops, the demand for American products increases.
6. Interest Rates
Interest rates are another important lagging indicator of economic growth. They represent the cost of borrowing money and are based around the federal funds rate, which represents the rate at which money is lent from one bank to another and is determined by the Federal Open Market Committee (FOMC). These rates change as a result of economic and market events.When the federal funds rate increases, banks and other lenders have to pay higher interest rates to obtain money. They, in turn, lend money to borrowers at higher rates to compensate, which thereby makes borrowers more reluctant to take out loans. This discourages businesses from expanding and consumers from taking on debt. As a result, GDP growth becomes stagnant.
On the other hand, rates that are too low can lead to an increased demand for money and raise the likelihood of inflation, which as we’ve discussed above, can distort the economy and the value of its currency. Current interest rates are thus indicative of the economy’s current condition and can further suggest where it might be headed as well.
7. Corporate Profits
Strong corporate profits are correlated with a rise in GDP because they reflect an increase in sales and therefore encourage job growth. They also increase stock market performance as investors look for places to invest income. That said, growth in profits does not always reflect a healthy economy.For example, in the recession that began in 2008, companies enjoyed increased profits largely as a result of excessive outsourcing and downsizing (including major job cuts). Since both activities took jobs out of the economy, this indicator falsely suggested a strong economy.
8. Balance of Trade
The balance of trade is the net difference between the value of exports and imports and shows whether there is a trade surplus (more money coming into the country) or a trade deficit (more money going out of the country).Trade surpluses are generally desirable, but if the trade surplus is too high, a country may not be taking full advantage of the opportunity to purchase other countries’ products. That is, in a global economy, nations specialize in manufacturing specific products while taking advantage of the goods other nations produce at a cheaper, more efficient rate.
Trade deficits, however, can lead to significant domestic debt. Over the long term, a trade deficit can result in a devaluation of the local currency as foreign debt increases. This increase in debt will reduce the credibility of the local currency, which will inevitably lower the demand for it and thereby the value. Moreover, significant debt will likely lead to a major financial burden for future generations who will be forced to pay it off.
9. Value of Commodity Substitutes to U.S. Dollar
Gold and silver are often viewed as substitutes to the U.S. dollar. When the economy suffers or the value of the U.S. dollar declines, these commodities increase in price because more people buy them as a measure of protection. They are viewed to have inherent value that does not decline.Furthermore, because these metals are priced in U.S. dollars, any deterioration or projected decline in the value of the dollar must logically lead to an increase in the price of the metal. Thus, precious metal prices can act as a reflection of consumer sentiment towards the U.S. dollar and its future. For example, consider the record-high price of gold at $1,900 an ounce in 2011 as the value of the U.S. dollar deteriorated.
Final Word
Since the health of the economy is intimately connected to consumer sentiment as can be seen by indicators such as retail sales, politicians prefer to spin data in a positive light or manipulate it such that everything appears rosy. For this reason, to accurately characterize the state of the economy, you must rely on your own analysis or perhaps the analysis of others without a particular agenda.Keep in mind that most economic indicators work best in corporation with other indicators. By considering the entire picture, you can thereby make better decisions regarding your overall plans and investments.
Which economic indicators do you usually look at when assessing the overall health of the economy?
>>>>>>>>>>>>>>>>>>>>>>>>>>>>>>>>>>0<<<<<<<<<<<<<<<<<<<<<<<<<<<<<<<<<<<<
What Are Economic Indicators?
An economic indicator is a metric used to assess, measure, and evaluate the overall state of health of the macroeconomy. Economic indicators are often collected by a government agency or private business intelligence organization in the form of a census or survey, which is then analyzed further to generate an economic indicator.Financial analysts and investors keep track of macroeconomic indicators because the economy is a source of systematic risk that affects growth or decline all industries and companies.
Which is the Primary Economic Indicator?
Gross Domestic Product (GDP)
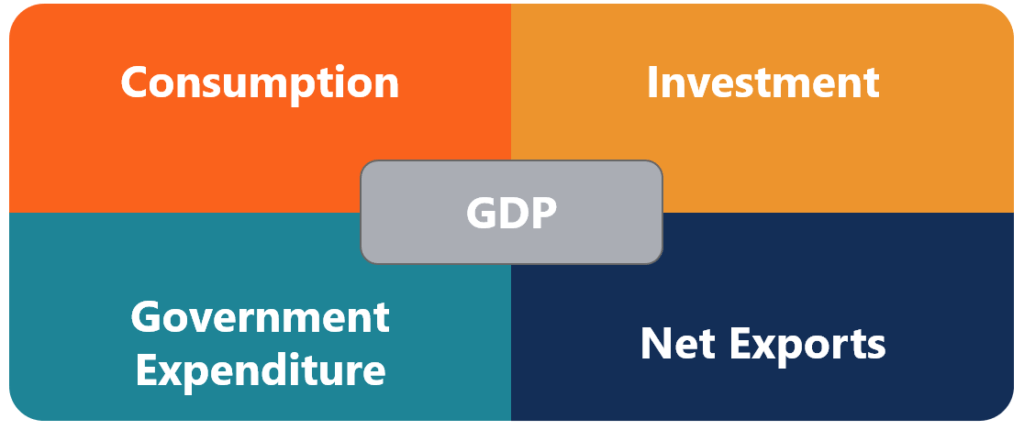
The GDP is widely accepted as the primary indicator of macroeconomic performance. The GDP, as an absolute value, shows the overall size of an economy while changes in the GDP, often measured as real growth in GDP, shows the overall health of the economy.The GDP consists of four components:
As of this writing, the only country to not use GDP as an economic measure is the Kingdom of Bhutan, which uses the Gross National Happiness index as an alternative.
However, for all its uses, GDP is not a perfect measure of the economy. It is because GDP can vary by political definition even if there is no change in the economy. For instance, the EU imposed a rule on indebtedness that a country should maintain a deficit within 3% of its GDP. By estimating and including the black market in its GDP calculations, Italy boosted its economy by 1.3% in its first year. It gave the Italian government more freedom in budgetary spending.
Another issue relating to reliance on GDP as an economic indicator is that it is released every three months. In order to make timely decisions, alternative economic indicators that are released more frequently are used. The indicators, which are selected based on a high predictive value in relation to GDP, are used to forecast the overall state of the economy.
What are Other Economic Indicators?
Purchasing Manager’s Index (PMI)
In the US, one of the most followed economic indicators is the Institute of Supply Management’s Purchasing Manager’s Index or PMI for short. The ISM’s PMI is a survey sent to businesses that span across all North American Industry Classification System (NAICS) categories to collect information on production levels, new orders, inventories, deliveries, backlog, and employment. The information collected can be used to forecast the overall business confidence within the economy and helps determine if it shows an expansionary or contractionary outlook.One of the reasons why PMI is one of the most followed economic indicators is because of its strong correlation with GDP while being one of the first economic indicators to be released monthly. The component GDP that the PMI most closely relates to is the Investment component.
Consumer Purchasing Index (CPI)
While not directly related to the GDP, inflation is a key indicator for financial analysts, because of its significant effect on company and asset performance. Inflation erodes the nominal value of an asset, which leads to a higher discount rate. Based on the fundamental principle of the Time Value of Money (TVM), it means that future cash flows are worth less in present terms.To measure inflation, one of the most followed indicators is the CPI. The measure of CPI is the change of prices of a basket of goods, relative to a base year. The formula is as follows:

A basket is aggregated by the most consumed consumer goods or services. The price of the basket is then measured against the same basket in the base year. CPI includes several variants.
Core CPI is the CPI excluding prices from energy and food-related products. It is because energy and commodity food markets experience high volatility in prices. Removing the two items provides a more stable measure of CPI.
List of Economic Indicators
Here is a list of the most common leading and lagging economic indicators:Leading Indicators
- Stock Market Performance
- Retail Sales Figures
- Building Permits and Housing Starts
- Level of Manufacturing Activity
- Inventory Balances
- GDP Growth
- Income and Wage Growth/Decline
- Unemployment Rate
- CPI (Inflation)
- Interest Rates (risking/falling)
- Corporate Profits
No comments:
Post a Comment